|
|
SAVING FUNCTION: The positive relation between household saving and household disposable income. The saving function is commonly presented as the saving line or propensity-to-saving line. The slope of this line is the marginal propensity to save, which is the proportion of any additional income used for saving. The saving function and the marginal propensity to saving play key roles in the multiplier and accelerator concepts. Because consumption is the difference between disposable income and saving, the consumption function is a complementary relation to the saving function.
Visit the GLOSS*arama
|
|


|

|
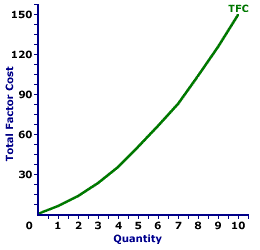
                           TOTAL FACTOR COST CURVE, MONOPSONY: A curve that graphically represents the relation between total factor cost incurred by a monopsony when using a given factor of production to produce a good or service. The total factor cost curve is most important in factor market analysis for the derivation of the marginal factor cost curve. Monopsony is a market structure with a single buyer or in terms of factor markets, a single employer. This means that monopsony is a price maker, with control over the buying side of the market. Market control means monopsony faces a positively-sloped supply curve. To buy a larger quantity, it must pay a higher price.The total factor cost curve reflects the degree of market control held by a firm. For a perfectly competitive firm with no market control hiring inputs under perfect competition, the total factor cost curve is a straight line that emerges from the origin. For firms with market control, including monopsony, oligopsony, or monopsonistic competition, the total factor cost curve increases at an increasing rate. The shape of the total factor cost curve thus indicates the degree of market control possessed by the factor buyer. Total Factor Cost Curve,
Monopsony |  |
The exhibit to the right displays the total factor cost curve for a hypothetical firm, OmniKing Island Resort. This firm is the only employer of labor on a small tropical island. As the only employer of labor on the island, OmniKing is a monopsony with extensive market control, and it faces a positively-sloped supply curve. To employ more workers, OmniKing must pay a higher price.The vertical axis measures total factor cost and the horizontal axis measures the quantity of input (workers). Although quantity on this particular graph stops at 10 workers, it could go higher. This curve indicates that if OmniKing hires 1 worker (at $6 per worker), then it pays $6 of total factor cost. Alternatively, if it hires 10 workers (at $15 per worker), then it pays $150 of total factor cost. For OmniKing the total factor cost "curve" really is a "curve." The slope of this curve rises as more labor is hired. The changing slope of this curve is due to the changing price. Although this total factor cost curve is based on the employment activity of OmniKing Island Resort, a well-known monopsony firm, it applies to any buyer with market control. Monopsonistic competition and oligopsony firms that also face positively-sloped supply curves generate comparable total factor cost curves.

Recommended Citation:TOTAL FACTOR COST CURVE, MONOPSONY, AmosWEB Encyclonomic WEB*pedia, http://www.AmosWEB.com, AmosWEB LLC, 2000-2024. [Accessed: May 3, 2024].
Check Out These Related Terms... | | | | | | | | | | | | |
Or For A Little Background... | | | | | | | | | | | |
And For Further Study... | | | | | | | | |
Search Again?
Back to the WEB*pedia
|


|

|
PINK FADFLY
[What's This?]
Today, you are likely to spend a great deal of time surfing the Internet seeking to buy either a T-shirt commemorating the first day of spring or a coffee cup commemorating last Friday (you know why). Be on the lookout for broken fingernail clippers.
Your Complete Scope
This isn't me! What am I?
|

|
|
The 22.6% decline in stock prices on October 19, 1987 was larger than the infamous 12.8% decline on October 29, 1929.
|

|
|
"It is the mark of an educated mind to be able to entertain a thought without accepting it." -- Aristotle
|

|
IBRD
International Bank for Reconstruction and Development
|

|
|
Tell us what you think about AmosWEB. Like what you see? Have suggestions for improvements? Let us know. Click the User Feedback link.
User Feedback
|


|


